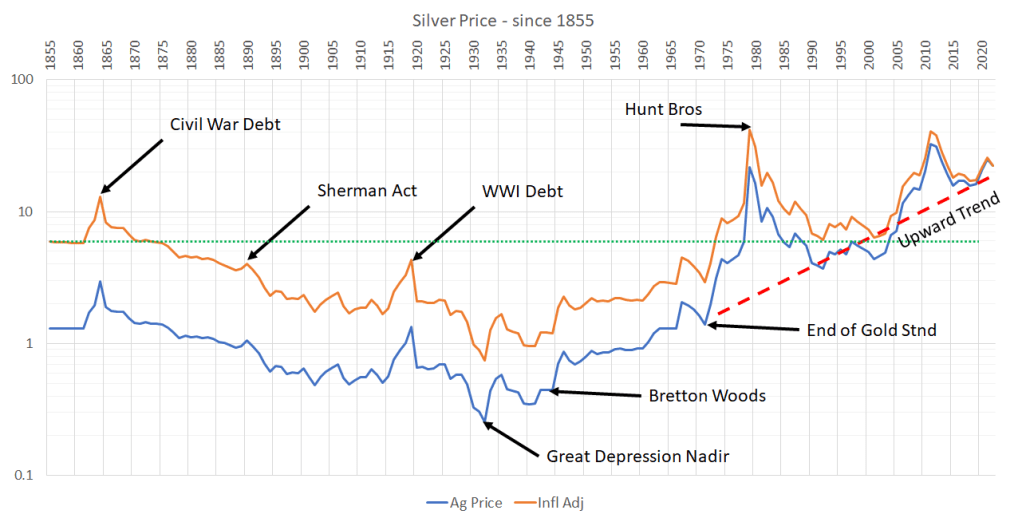
Leading up until the 1860’s silver had a set price, about $1.29 per ounce. And it had stayed that price since 1792 with the inception of the Mint Act. What changed in the 1860’s to bring about the first drastic price change? And what effect did that change have on the Western US?
Historically speaking, the price of precious metals has been a currency base and set price by the government. Of course, until Nixon fianlly floated the dollar and removed the gold standard altogether in the early 1970’s. But that is later on in the story, so let’s rewind to the start again.
The first significant change in silver price after setting it’s price with the Mint Act at $1.29/ounce was the US Civil War. The debt from war drove the price of silver up. In tandem with this was budding silver mining in Nevada, which became a state at the same time that the Comstock Lode in Virginia City was taking off. Seemingly over night, silver price had tripled ($2.94/ounce) and supergene silver ores in Nevada were ripe for the picking. Not only did Virginia City take off at this time but other towns such as Belmont, Eureka, and Austin in Central Nevada were getting their start during this era as well.
The bimetallic monetary system from the 1792 Mint Act began to unravel with Coinage Act of 1873 which effectively de-monetized silver. This in turn created weakness in demand and with increased silver production in the Comstock and elsewhere throughout Nevada this led to a steady declining price. Still more government policy, in the Sherman Silver Act of 1890, attempted to correct for a price that had dipped below its previous fiat of $1.29/ounce thru the purchase of silver and minting of coins. However, this policy ultimately resulted in the Panic of 1893.
The complete abandonment of silver within a bimetallic monetary system came about thru the Gold Standard Act of 1900. Gold became the sole precious metal where paper notes could be exchanged for gold on demand. Thus, silver continued its decline in price lasting nearly until the end of WWII but seeing a nadir during the Great Depression.
One noteworthy price rebound was a brief spike centered around the war debt from World War 1. During this time the Monitor Belmont Mining Company built a flotation mill on the site of the orginal Highbridge Mill at Belmont, NV (circa 1915). This brief episode capitalized on the price rebound of silver and reprocessed some of the old mine dumps as well as dewatered some old mine level for additional underground mining efforts.

The turning point for silver came about thru the Bretton Woods agreement in 1944, where countries adopted the dollar as the world’s reserve currency backed by gold, which was set at $35/ounce by FDR (a devaluation of the metal by 70% at that time). Again, throughout Nevada there was a brief lived interest in silver district such as Belmont, Tonopah, Austin, and Eureka during this war time era.
Interestingly enough, the majority of the silver mining that put Nevada, “the Silver State”, on the map, came from the period of time when silver price was at historic lows. Aside from the initial spike in price due to the Civil War, silver mining was continually chasing down a declining silver price until the Great Depression. Any and all silver mines and deposits from that time would have suffered from a continual need to mine more and more high grade ores. This continual pressure would have driven many out of business and forced many to leave much that is economic today still in place.
By the time Nixon completely dissolved the Gold Standard in the early 1970’s, silver had already benefited from several decades of rebound. So by the time the Hunt Brothers caused a run on physical silver bullion by 1979 we still haven’t seen its equal. When you adjust for inflation, peak silver price in 1979 is nearly $42/ounce in today’s money.
So it would seem that silver has seen a long-lived macro bull market from its nadir in Great Depression era. And this would be true at face value except for one important fact. Silver’s base price of $1.29/ounce, when adjusted for inflation, is closer to $6/ounce in today’s money. This means that since the end of the Civil War until the end of the Gold Standard was simply one big silbver price trough. And realistically, in today’s electrification future since the Dot Com era and now with solar panels and EVs becoming so much more prevalent, we are finally in an era where a) the government is not price fixing silver’s value and b) the industrial worth of the metal can be freely expressed in terms of it’s value outside of a monetary system.
Additionally, silver is mined moreso as a byproduct theses days; chiefly from gold mines that aren’t mining for the white-colored metal. In the Silver State there are several abandoned silver-dominant districts that has been entirely overlooked by gold exploration companies time and again. And as I’ve written in a previous article, these silver-dominant systems could also be an excellent source for other critical minerals.
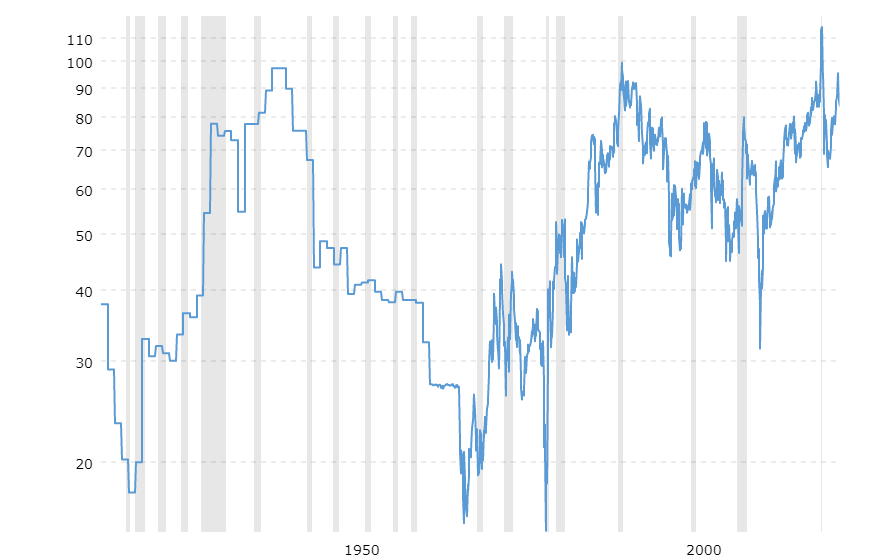
Below are some charts for reference with links to the source of this data. Each chart is logrithmic and inflation adjusted with recessions marked out in grey. These are 100 year charts, so they don’t reach as far back as my original data set above, but they tell the story nonetheless.
Silver Prices – 100 Year Historical Chart

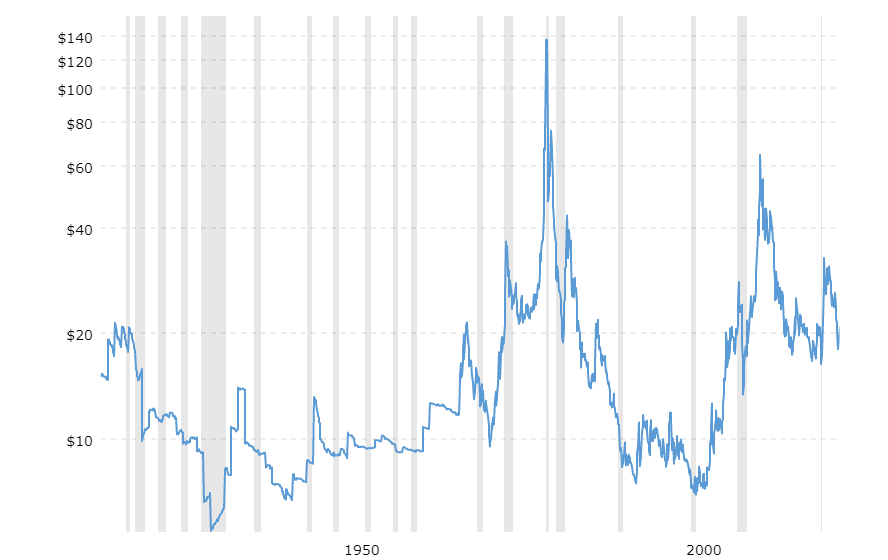
Gold Prices – 100 Year Historical Chart