Introduction: The Seed Corn Problem
Civilization runs on minerals. Gold may glitter, but copper carries our current, uranium powers our grids, and rare earths anchor the very magnets that spin the world. Without them, the skyscrapers don’t rise, the phones don’t ring, and the servers that feed the cloud go dark. Mining is not just an industry; it is the bedrock upon which every other modern enterprise rests.
And yet, here we stand in 2025, after more than a decade of neglect. The global mining industry has starved its own “R&D department”—exploration. Budgets have been slashed, geologists retired without replacement, and entire districts left unmapped since the 1980s. Instead of planting seeds for the future, the sector has lived off old harvests, leaning on deposits discovered by the last great exploration wave of the 1960s–1990s.
It’s the equivalent of eating the seed corn to make it through winter. Yes, you may survive the lean season, but when spring arrives the fields are bare. The industry now faces a generational dilemma: demand is rising with electrification, AI-driven power consumption, and defense needs, but the pipeline of new discoveries is running dry.
The warning signs are already here. Grades are falling, permitting timelines stretch a decade or more, and the very talent pool of geologists—the human capital that finds ore before machines can mine it—is shrinking. The exploration torch is passing out, just as the world needs it most.
This is the seed corn problem: an industry that mistook austerity for efficiency, cost-cutting for strategy, and in doing so mortgaged its future.
Why Exploration Matters
Exploration is the ghost in the machine—the unseen force that keeps the gears of civilization turning. Mines are not infinite. Ore bodies deplete, grades decline, and production costs inevitably climb. Without a steady stream of new discoveries, the reserves that underpin our supply chains wither away.
When exploration falters, the ripple effects are immediate and profound:
- Depletion at the source: Mature mines close or shift to lower-grade zones, requiring more energy, more water, and more waste rock for every ton of metal produced.
- Fragile supply chains: Scarcity tightens the noose. Nations grow dependent on single suppliers or unstable jurisdictions, inviting shortages and geopolitical choke points.
- Economic exposure: Industries that appear cutting-edge—AI, data centers, quantum computing, crypto, electric vehicles, wind turbines, solar panels—become castles built on sand, unsupported by the very raw materials that make them possible.
History proves the point. The U.S. uranium boom of the 1950s, the global porphyry copper discoveries of the 1960s and 1970s, and the Carlin Trend gold rush in Nevada all reshaped economies and societies. But each relied on bold, boots-on-the-ground exploration—and each took decades to bring from discovery to production. Without planting new seeds today, there will be no harvest tomorrow.
Exploration is not optional. It is the bedrock of resilience, the insurance policy against scarcity, and the quiet act of faith that there will still be metal in the mill when the world comes calling.
What Happened to the Juniors?
Once, junior explorers were the daring prospectors of capital markets. They were scrappy, nimble, and driven by geologists with calloused hands and big dreams—funded by retail investors and risk-tolerant funds who saw the outsized upside of a drill-bit discovery. They were the seed planters.
Today, they’re skeletal. The ecosystem that once sustained them has been hollowed out by a perfect storm of mistrust, market shifts, and changing appetites for risk.
- Burned Trust (2011–2015): Billions vanished in the last gold cycle. Over-promises, bad geology, and outright scams poisoned the well. Investors fled, leaving legitimate juniors to starve alongside the frauds.
- ETF Domination: Passive index funds became the new custodians of capital. They allocate by market cap, not by exploration potential. Drill holes don’t move the needle. The capital pool that once flowed freely into high-risk discovery stories has shrunk to a trickle.
- Retail Drift: The everyday investor who once bought a thousand shares of a penny-stock explorer on a hunch now chases tech IPOs, cannabis booms, meme stocks, and crypto tokens. Rocks lost their shine in a world of instant returns and digital buzz.
- Risk Aversion: Institutional capital demands cash flow, not speculation. Money flows to mid-tiers and majors who can produce quarterly results, not to juniors who burn cash in search of something that may not exist.
The result? An entire generation of junior companies reduced to husks—managing legacy properties, eking out survival on private placements, or vanishing altogether. Where once the TSX-Venture exchange was a bustling bazaar of discovery, it is now a thinly traded echo chamber.
The juniors are left begging for scraps. And without them, the pipeline of new discoveries—the very seed corn of the mining industry—runs dry.
Why the Majors Look Away
Big mining companies are not innocent bystanders in this drought of discovery. They’ve made a calculated choice—a choice that prioritizes quarterly comfort over generational security.
- Dividends > Drills: Shareholders demand yield, not uncertainty. The likes of BHP, Rio Tinto, and Vale trumpet their dividend programs as proof of “discipline,” funneling billions back to investors instead of into the geologists who might find tomorrow’s ore bodies. The City of London and Bay Street cheer, but the exploration pipeline withers.
- M&A Is Easier: Why risk the cost and uncertainty of greenfield exploration when you can let juniors shoulder the burden and then swoop in later? Barrick, Newmont, and Anglo American have built portfolios on acquisitions rather than discoveries, paying premiums for ounces once desperation sets in. This strategy works only as long as juniors exist—and today, even that seedbed is failing.
- Permitting Pain: In the U.S., a new mine can take 10–15 years to permit. In Chile, Peru, and Argentina, political shifts and social unrest regularly derail development. Even Canada, once a paragon of mining stability, has bogged down in federal-provincial wrangling. To the majors, exploration feels like wasted effort if politics can veto production. Why drill if a discovery just becomes a stranded asset?
- Artificial Scarcity: A tighter project pipeline props up higher commodity prices. For majors, scarcity is profitable—at least in the short run. Copper prices hold stronger when new supply is uncertain. Uranium equities rally when no new projects are breaking ground. But this “discipline” is short-sighted. Artificial scarcity enriches today’s balance sheets while mortgaging tomorrow’s grids.
The majors’ restraint looks like prudence, but in truth, it is systemic neglect. They have mistaken risk aversion for strategy. Instead of seeding the next generation of mines, they are cannibalizing the last generation’s discoveries, hoping someone else will do the dirty work of prospecting.
Yet “someone else” no longer exists. The juniors are starved, governments are paralyzed, and the majors have parked their drills. The system is eating itself.
The Timeline of Consequences
The story of exploration neglect is not abstract. It unfolds on a clock, with milestones as predictable as they are dire. Here’s what we will see in the coming year, 5 years, and 10 years if this pattern of neglect is allowed to continue:
📍 1 Year (2026): The Plateau (if this isn’t already the case)
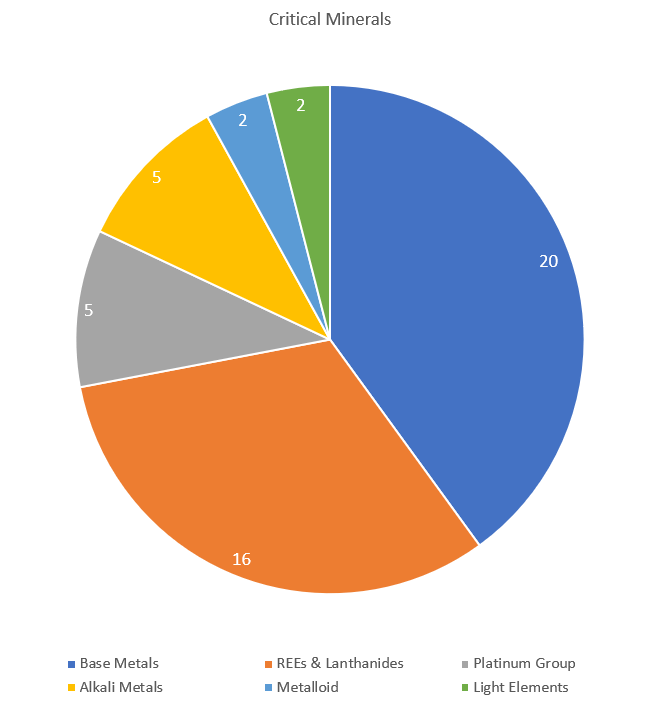
- Reserves continue to shrink across commodities—global copper reserves, for example, are already skewed toward lower-grade porphyries that cost twice as much to mine as their predecessors.
- Senior geologists retire, taking with them decades of local knowledge about belts in Nevada, the Andes, and the African Copperbelt. Their field notebooks, often never digitized, gather dust in basements.
- Once-vibrant districts—like northern Ontario’s greenstone belts or the Carlin Trend in Nevada—begin to lose their intellectual “muscle memory.” The living knowledge that connects old drill logs to new targets vanishes.
📍 5 Years (2030): The Gap
- Project pipelines hollow out. The majors’ development schedules, already thin, collapse into a handful of advanced brownfield expansions.
- Juniors consolidate into survival mergers or collapse outright, leaving only a skeletal handful of companies with active drills. The TSX-Venture—the historical cradle of global discovery—is reduced to a backwater of shell companies and recycled management teams.
- Governments scramble to reverse decades of neglect: Washington floats “Critical Mineral Moonshots,” Brussels pushes exploration tax credits, Beijing doubles down on African offtake agreements. But the measures are too late. You cannot conjure ore bodies with subsidies once the drills have gone silent.
- Supply deficits bite. Copper, lithium, and rare earths become the new oil shocks—triggering inflation, power rationing, and trade wars over who gets the last shipments.
📍10 Years (2035): The Ghost Tap
- You cannot turn on a tap that isn’t connected to a pipeline. Mines take 10–20 years to permit and build. By 2035, the missing decade of exploration has come due.
- Critical minerals are no longer market stories—they are national security flashpoints.
- China leverages its dominance in rare earths to dictate terms in global trade.
- The U.S. Defense Department stockpiles uranium and cobalt like Cold War-era oil.
- Europe, unable to build batteries without imported lithium, faces rolling blackouts and stalled EV adoption.
- Even record-high commodity prices won’t matter. A $15,000/t copper price or $200/lb uranium price won’t magically materialize new deposits. Discovery takes decades, and the decade has already been lost.
- The result is a ghost system: idle smelters, shuttered gigafactories, and stalled wind and solar farms—technology stranded for want of the materials that should have been planted years before.
The Geopolitical Context
We are entering an era where geology is geopolitics. Control of the periodic table is now as decisive as control of sea lanes or satellite constellations.
- China throttles rare earth exports, weaponizing its near-monopoly in magnets and battery materials. Its Belt and Road Initiative has already secured lithium and cobalt across Africa and South America.
- Russia leans into resource nationalism, tying uranium exports and energy corridors to its foreign policy goals. Kazakhstan—producer of over 40% of the world’s uranium—sits in Moscow’s orbit.
- India is no longer just a consumer but an aggressive competitor, racing to lock down lithium supplies in Argentina and rare earth projects in Australia.
- The West risks becoming a permanent importer, dependent on rivals for the metals that power its grids, weapons, and economies.
This is not about abstract “market dynamics.” It is about whether democracies will control their own futures.
Without uranium, copper, lithium, and rare earth elements, there is no AI revolution, no data center backbone, no renewable transition, no electric vehicle fleet. Strip away the minerals, and the high-tech towers of modernity collapse like sandcastles in the tide.
And here lies the hard truth: exploration is the first act of sovereignty. Mines take 10–20 years to permit and build. If we do not plant seeds now, by the 2030s the United States and its allies will be paying whatever price Beijing or Moscow demands—or doing without altogether.
The call to action is clear:
- Reinvest in exploration with the urgency of a Manhattan Project—geological surveys, public-private partnerships, and incentives that pull risk capital back into the field.
- Build Western supply chains that can withstand geopolitical shocks, from Nevada lithium to Saskatchewan uranium to Australian rare earths.
- Treat geology as strategy, not afterthought. The United States Geological Survey should be viewed with the same seriousness as the Pentagon, for both are guardians of national defense.
This is the rallying cry for the U.S. and its allies: sovereignty begins at the drill rig. Without exploration, there is no mining. Without mining, there is no economy. Without an economy built on secure foundations, there is no freedom to defend.
A Glimmer of Policy Reform
For all the gloom, there are sparks of recognition—early shoots that hint the field may not be barren forever.
- FAST-41 Permitting Reform: Once a bureaucratic chokehold, permitting in the U.S. is showing signs of movement. The Federal Permitting Improvement Steering Council (FAST-41) is beginning to streamline timelines for “covered projects.” Uranium juniors like Anfield Energy with its Velvet-Wood mine in Utah, and EnCore Energy with Dewey-Burdock in South Dakota, have already secured wins under this process. What once looked like stranded assets are edging toward daylight.
- Pentagon–MP Materials Partnership: The U.S. Department of Defense has invested directly in MP Materials’ Mountain Pass rare earth mine in California—hundreds of millions of dollars in contracts to secure separation and magnet manufacturing capacity on U.S. soil. This is no boutique project: MP Materials controls the only rare earth mine (of scale) in the U.S. and is ramping toward vertical integration that could anchor a Western supply chain.
- Copper as a Keystone: Projects like Resolution Copper in Arizona—one of the largest undeveloped copper resources in the world—remain politically tangled, but their scale makes them unavoidable. If unlocked, Resolution alone could supply up to 25% of U.S. copper demand for decades.
- Lithium Rising: The controversial but progressing Thacker Pass project in Nevada, and Ioneer’s Rhyolite Ridge, have secured federal loans and partnerships, positioning the U.S. as a serious player in lithium carbonate production. Thacker Pass, with more than $2 billion in projected investment, is not just a mine but a downstream refining hub in the making.
- Downstream Momentum: Supply chains are finally catching political attention. From rare earth magnet plants in Texas to lithium hydroxide refineries in Nevada, the U.S. is beginning to invest not only in the rocks, but in the capacity to turn them into finished products. That is the true measure of sovereignty.
These reforms are encouraging, but they are still small strokes on a canvas that demands bold, sweeping lines. A handful of permitting wins and defense contracts are not a revolution. What’s needed is a scale-up—tenfold, a hundredfold. Only when the U.S. and its allies treat minerals with the same urgency once reserved for oil, or for the space race, can we say things have truly changed.
This glimmer is fragile, but it is real. If fanned, it could light the torch of a new exploration renaissance.
Conclusion: Choose Risk or Embrace Ruin
The mining industry thought it was playing it safe by pulling back on exploration. In truth, it was gambling the future—trading short-term stability for long-term scarcity. The result is hollow pipelines, fragile supply chains, and a generation of geological knowledge at risk of fading into silence.
Exploration is not a luxury. It is the R&D of civilization itself. Without it, there is no copper for wires, no lithium for batteries, no uranium for baseload power. Starve exploration, and we starve the future.
The real risk isn’t in drilling holes—it’s in failing to drill them. The world’s faucets are running, but the reservoir is dropping. The only question that remains is whether we have the vision and courage to dig the next well before the water stops.
For those still with me at the end of this essay, here’s the wry truth in one line:
“Exploration: the riskiest bet we can’t afford not to make.”